Infographics
Sometimes words alone just don't cut it. Here are a few infographics I've co-created with designers – used to simplify complex ideas, reinforce messaging, break up the scroll, and repurpose across social media and email.

This infographic accompanied an article on building a healthier relationship with social media — illustrating tips like following healthcare professionals and using platforms to build genuine community.
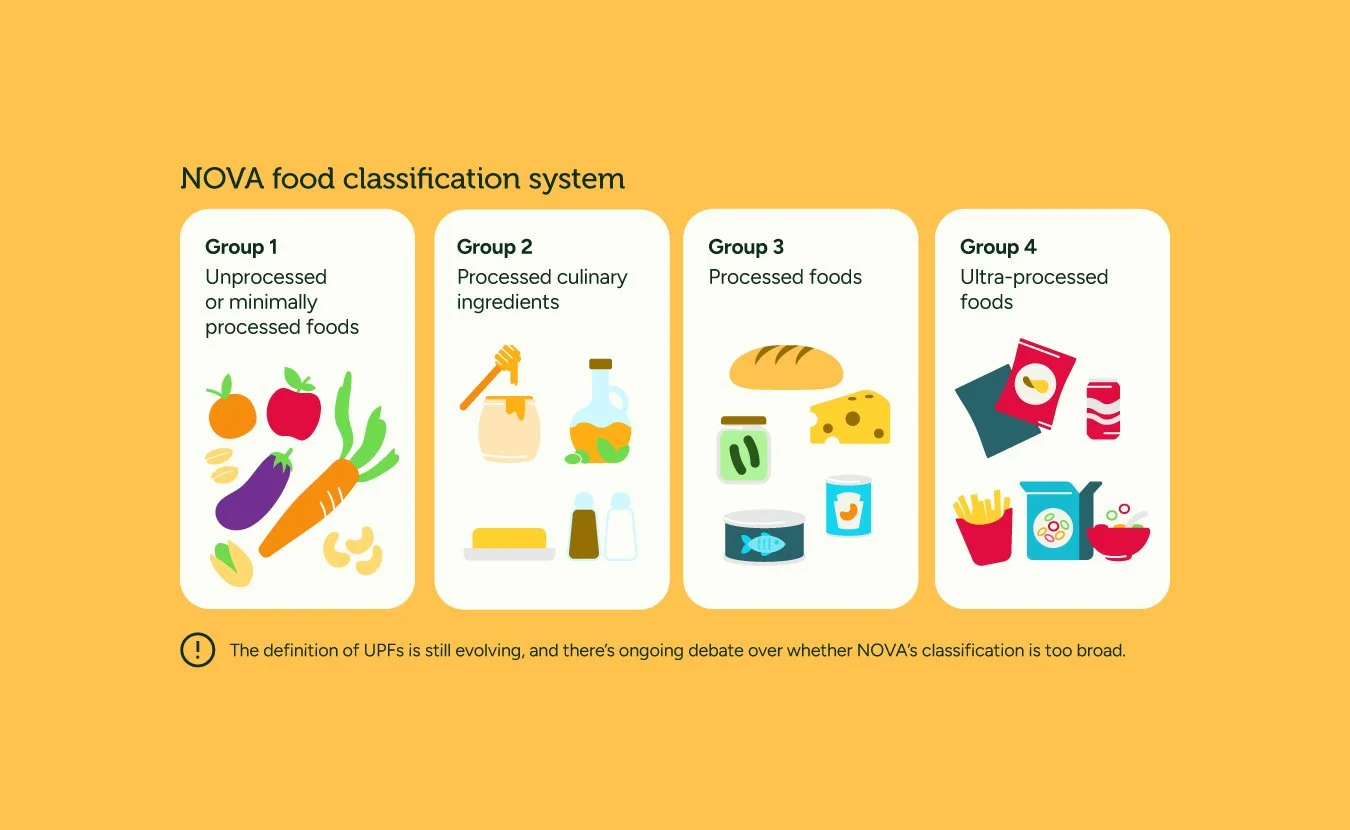
A nutrition infographic for an article on ultra-processed foods, explaining the NOVA classification groups and including a caveat on the definition on UPFs and the classification system itself.
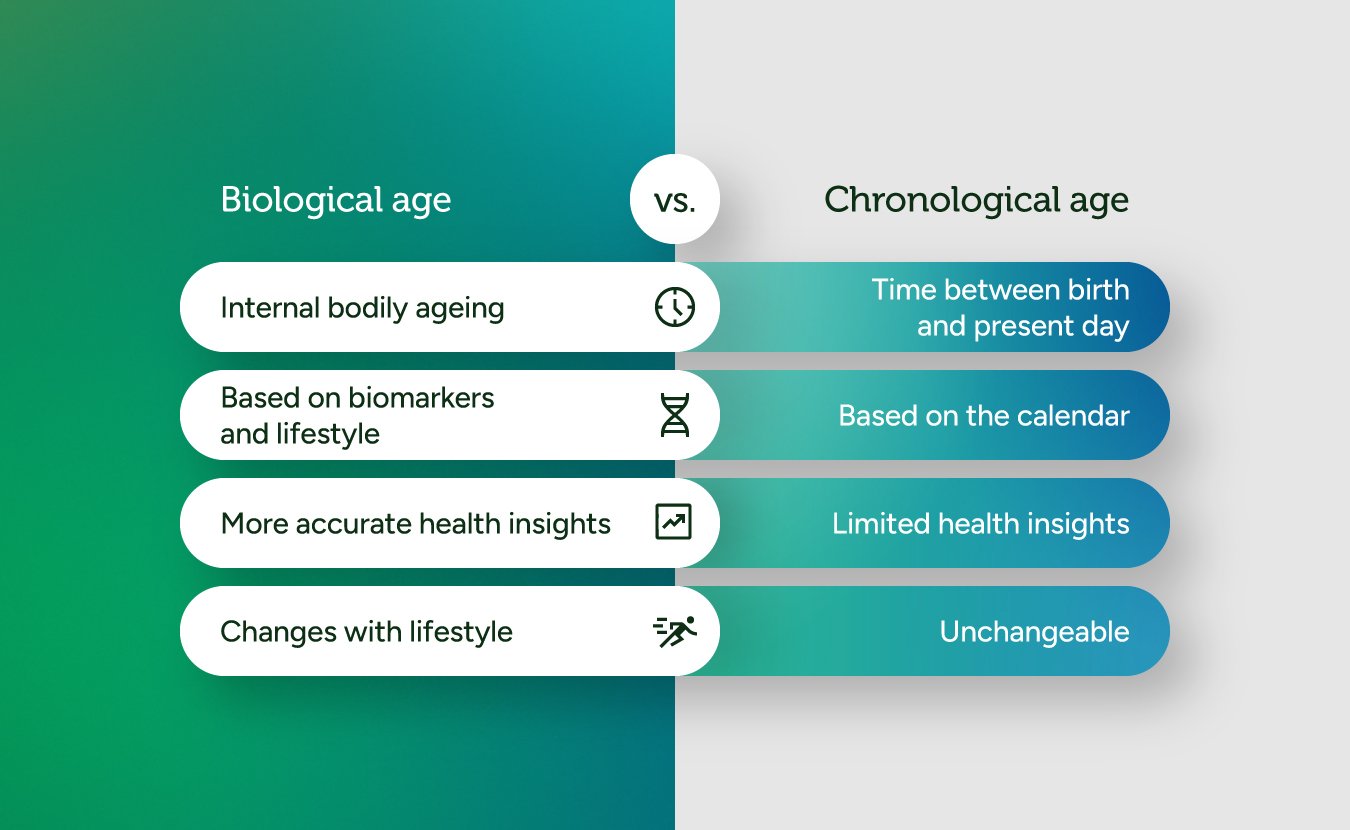
A comparison table illustrating the differences between biological age and chronological age — a concept that was new to most app users at the time, designed to make a complex idea scannable and easy to grasp.
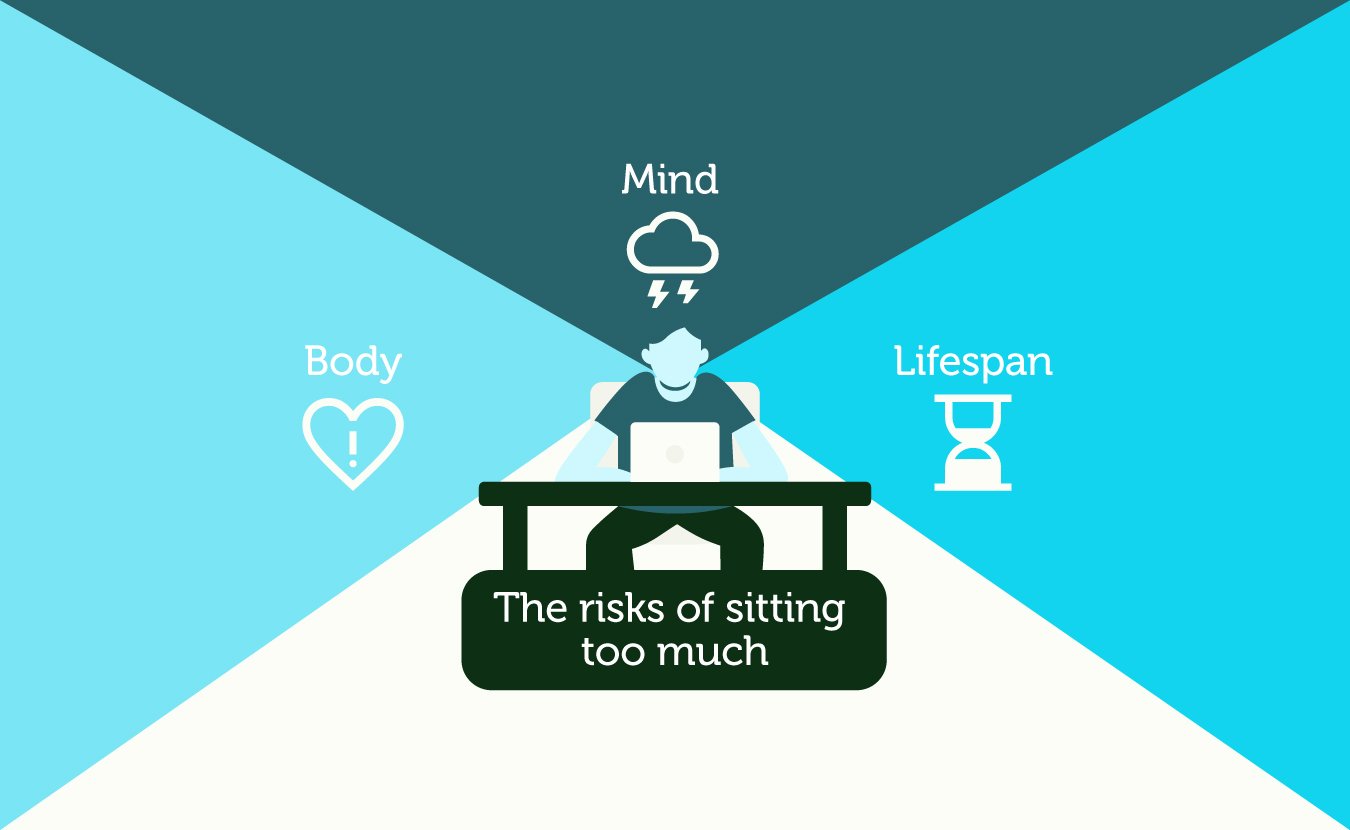
An infographic illustrating the impact of sedentary behaviour on different aspects of health. Designed for app users as part of an ongoing engagement content calendar.
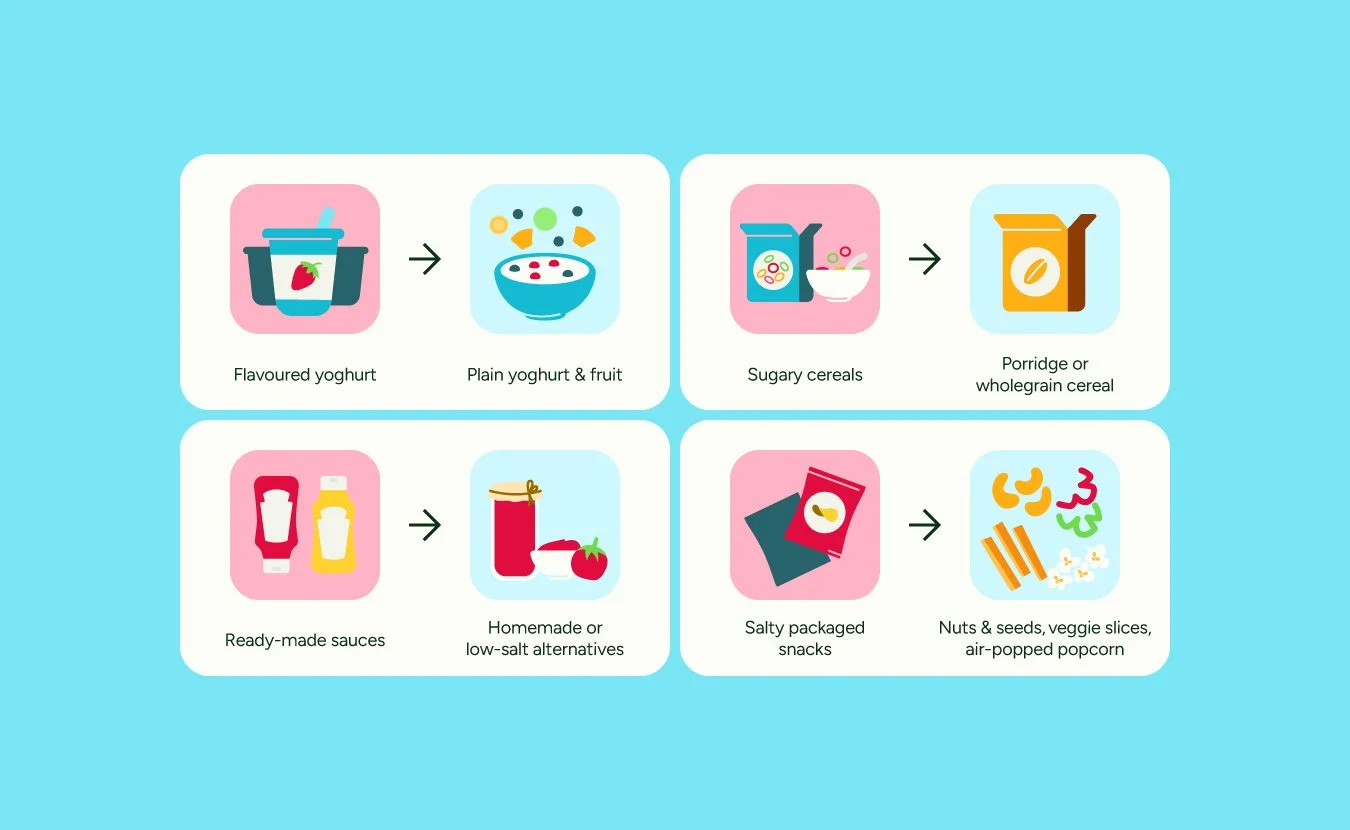
A visual guide to simple, everyday food swaps – turning a potentially preachy nutrition topic into something accessible and actionable for app users.
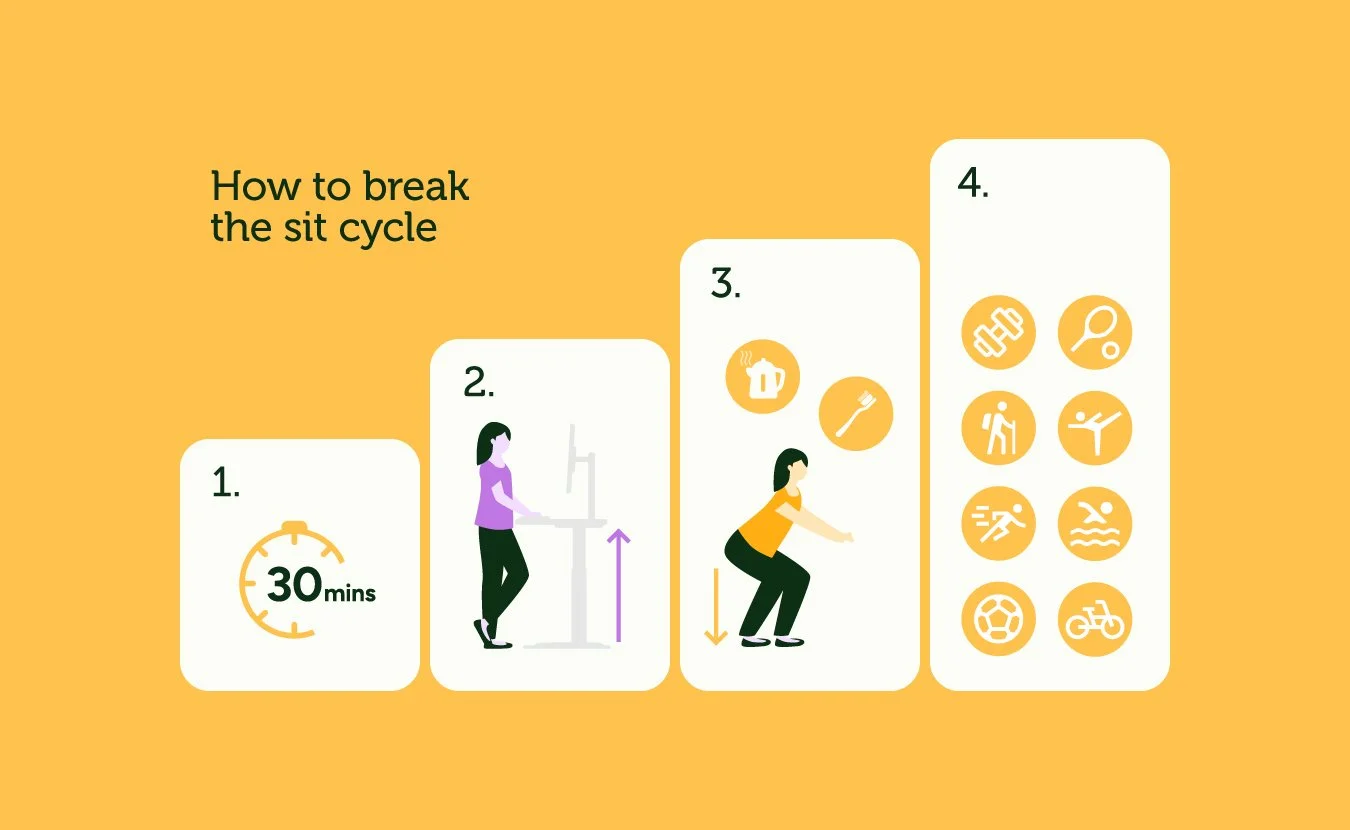
A visual guide to breaking the sitting cycle — designed to stop the scroll and reinforce key messaging from the accompanying article.